1] Debugging Javascript by using Mozilla's Firebug.
2] Debugging Javascript by using Internet Explorer.
1] Mozilla's Firebug:
1) Visit firebug's website to install firebug to browser.
2) Click add to Firefox

3) Firebug's icon appears in right corner of the browser.
5) Click the console tab.
6) Click F5 or refresh the web page. If there is any error in javascript it will get displayed in console.

7) When the program runs successfully you can check the parameter ie. input and output values.
Goto console --> All-->click + Get http:// ...........
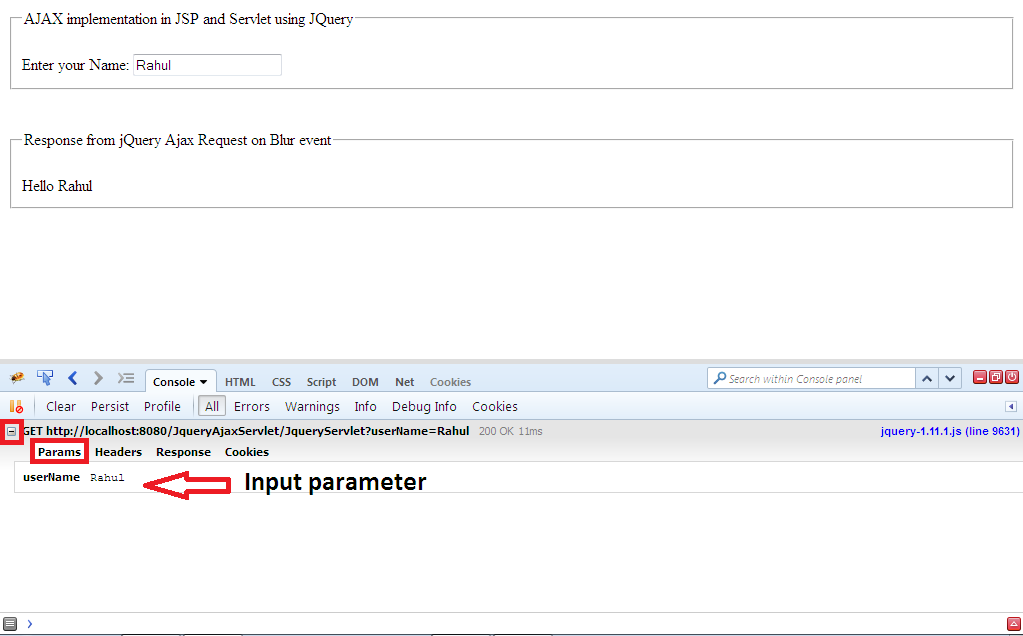

8) You could also view which method is being used GET or POST , along with time taken to complete the request.


2] Debugging using Internet Explorer:
1) From menu bar click tools--> Internet options--> select advanced tab --> Under Browsing section uncheck Disable script debugging for both Internet Explorer and Other--> check Display notification about every script error--> Click Apply--> click Ok

2) Pop-up will appear each time when there is a error which will display the line no. of the error

3) Click yes. It will display the error in console.
4) You can manually debug by pressing F12. Then set debug point and click start Debugging.
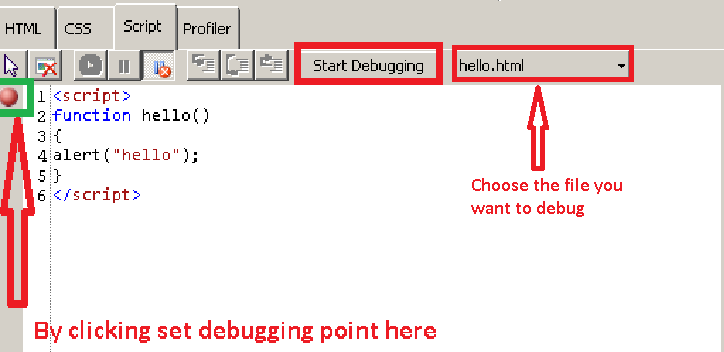
Then press
F11 for Line-By-Line debugging.
Shift+F11 for step out.
5) Network Debugging

| URL : | The requested URL. |
| Method: | The HTTP method POST or GET. |
| Result : | The HTTP response code. |
| Type : | The type of content that is received. (image, text/html etc.) |
| Received: | The total amount of data that is received, in bytes. |
| Taken : | The total time elapsed to receive the content, in milliseconds. |
| Initiator : | The Internet Explorer subsystem that initiated the request (if it is known). |
| Timings : | A timeline of the network events. The request time is indicated in yellow, and the response time is shown in blue. |